Oracle Database Appliance: Storage Performance -- Part 1
Today I want to show what kind of IO performance we can get from Oracle Database Appliance (ODA). In this part, I will focus on hard disks. That's right -- those good old brown spinning disks.
I often use Oracle ORION tool to stress-test an IO subsystem and find it's limits. It's a very simple and handy tool and usually provide most of the IO simulation I need.
I usually benchmark for small random IOs and for large sequential reads. This gives me a good idea what I can expect from this IO subsystem for OLTP workloads as well as bulk data processing workloads including data warehousing, backups and batch activity. I usually don't stress test mixed workload until I know what's the profile of the application that I will run on this platform. In this particular case, I'm more after generic IO stress test and finding the limit.
Today, let's talk about small random IOs which is the attribute of the OLTP workloads. I'm interested in single IO response time and IOs per second (IOPS).
When I stress test an IO subsystem I usually process average numbers but I always remember that averages are just that -- averages. Because my artificial ORION workload is pretty randomly distributed and I use reasonably small intervals, the results have good confidence for me but in some cases I would want to dig further and collect some histograms of IO latencies. I haven't done it for Oracle Database Appliance though and knowing what's behind I expect response time to be quite consistent - there is no disk cache or something similar that skews response time.
I should note that I use term IO response time and IO latency interchangeable here in case you are using these terms differently. It might be a bad habit but that's what I do.
Before I stress test an IO subsystem, I usually set some expectations. Let's do the same here. ODA has 20 disks - 15K RPM SAS disks. My experience tells me that I should expect very good single IO latency (below 10ms) from these disks serving at least 100 IOPS each. I also expect that these disks will still provide reasonable response time if you crank up the workload to about 200 IOPS but this is where I would see much higher response times -- getting into 20ms range. Now, I know that 15K RPM SAS disk can deliver even more IOPS each but then IO response time becomes generally unacceptable for OLTP systems. In fact, 10 ms target is what's been a good rule of thumb in the last decade. I try to perform perform IO stress tests with different percentage of writes to see the impact of the write activity. This is useful when I assess IO capacity for a particular application where I can predict IO patterns or measure the existing pattern. Again, I have certain expectations here. For RAID5, RAID-DP, and all kind of other RAID-F levels that use parity one way or another, I expect that sustainable IOPS level to drop significantly as write activity becomes more dominant. No matter what magic solutions vendors implement, sustained IOPS always drop or so I've seen until now.
ODA disks are not mirrored until ASM performs host based mirroring but I'm collecting IO numbers below ASM so I expect very little IOPS degradation from write activity or even positive impact - i.e. reduced *average* response time and increased IOPS throughput. This happens usually when RAID controllers or SAN arrays have reasonable write cache and it's not being saturated.
But enough words… let's jump to what I love most here - numbers and their visual representation - charts!
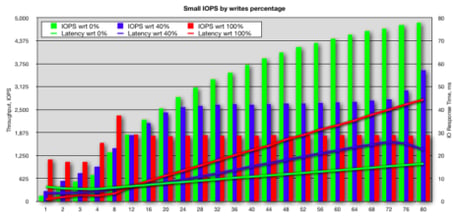
I've noticed a new run option in ORION -- "-run oltp" --- so I decided to give it a try. This options seems to trigger lots of parallel IO threads (much more than "normal" number for the number of disks defined). I think it's way too high but it does have good indication of write IOs impact. I would still re-do different write percentage tests using a more traditional ORION options.
Back to the chart above -- what do you see from this chart? I see that we do get around 100-150 IOPS on average from each disk (remember we have 20 of them) while average IO response is within 10 ms. That's right on the money. I can also see that random IOs throughput scales up to 200-250 IOPS while IO response time is still within 20 ms range. We can even see that the disks are able to provided sustained 300 random IOPS but at a cost of very high average IO response time. Note that write overhead is minimal here which is in-line with my expectations.
To summarize, you can expect ODA to deliver easily 3000 IOPS whether read or write with average IO response time up to 10ms and almost double that if you can afford average random IO response time to raise up to 20 ms. While higher throughput is possible, practical usability is limited unless you have highly parallelized batch jobs doing massive small random IOs. However, you probably have very inefficient data processing in your application design then. We can also conclude that write activity has minimal impact on throughout as you would expect from a non-RAID5 system.
Word of caution about write IO accounting and planning with ASM mirroring. ORION reports number of non-mirrored writes. If you are using normal redundancy, you need to double number of writes for your capacity planing and triple them for ASM diskgroup created with high redundancy. For example, if your capacity planning dictates that you need 1000 random IOPS and 200 write IOPS and you are using high ASM redundancy, you will need to plan for 1600 IOPS with 37.5% of write IOs. If your mirroring is done on the level below ORION then your numbers already account for mirror writes.
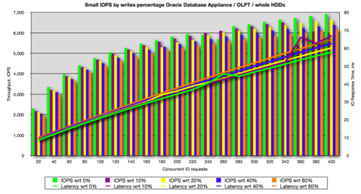
Let me compare this to a small-scale direct attached storage with RAID controllers with some write cache:
The chart above is not from ODA but I give it as a comparison. Those are four 15K RPM SAS directly attached internal disks. Note that throughput slightly increases as you add write IOs into the mix and average IO response time drops. If I increase writes percentage my throughput is further increasing (I didn't have it on the chart) and if I look into average response time of reads and writes, I'll see that average write latency is much lower then read latency -- I believe this is an impact of RAID array caching in this case. Note that I mention RAID array but it's configured to present disks as JBOD so that ASM is in charge of mirroring and striping.
I want to take on more moment and demonstrate why Oracle's decision to use just RAID1-like mirroring in ASM is so much better then parity-based mirroring (mind you for HDDs, SSD might be a different story but let's not go there now). Below is RAID5 configured group of a small 3Par SAN array (benchmark done more than a year ago):
You can notice that even introducing 10% of writes (purple) exhibits noticeable degradation on throughput and average response time. Growing write activity up to 40% (blue), you get throughput drop 3-4 times compare to our random reads (green). You can also notice that 3Par caching helps on the low throughput levels but it quickly gets saturated and write IO drags performance of the whole subsystem down.
Now let's have a look at the same 3Par array but re-configured using RAID1+0 -- the same physical disks and the same SAN-FC infrastructure:
 40% of writes starts having visible impact only after reaching good level of 2500 IOPS but then if you calculate additional mirror writes on the SAN, you will see that we simply reached physical disks IOPS capacity. Going further, if all your IO activity represented by 100% writes (red), IO degradation is still reasonable (remember to double the number to get to the real number of random writes going to disks due to mirroring on the SAN box). Interesting phenomenon again here -- on lower activity levels, writes are actually performing much faster. I believe it's because battery backed write cache with capacity is enough at this workload level so writes re-arranged and done much more efficiently. So the same write cache works much more efficiently with RAID1 as opposed to RAID5. I find it fascinating that storage vendors still push us to RAID5 arguing that because of their write cache know-how technology, parity-based RAID arrays magically perform better than good old RAID1.
OK. Now it's time to get back to ODA. I wanted to rerun my test using smaller degree of concurrency to visually see how it scales. I was satisfied with my write IO impact analysis by now but I wanted to measure how much benefits we get using outer versus inner areas of the disks. Traditionally, the outer part of a disk is considered faster than inner area - data is more dense and is read faster on an outside track and also head moves are shorter since it only needs to move between fewer number of outer tracks.
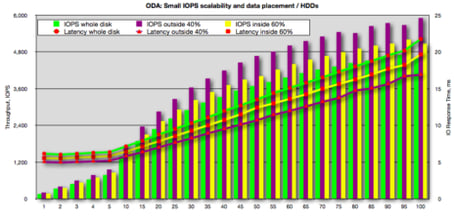
I run the benchmark and used 3 test cases - using whole disk, using first 40% of the disk capacity (meaning it should be on the outer tracks) and then using the rest 60% of the disk (meaning it's inner tracks). The results are below in the same familiar format for IOPS throughput and average IO latency / response time.
One might expect that outer part of the disk is the fastest and inner part is the slowest while the whole disk performance would average in between. In reality, the biggest savings in response time are coming from the fact that disk heads don't need to move that far whether you limit data placement to a set of outer track or set of inner tracks. What's reduced is head movement latency component of IO response time while rotational latency stays about the same and more dense data placement on outer tracks doesn't affect latency.
This is exactly what we see - the outer 40% is the fastest followed by the inner 60% area and whole disk area is slower because heads are need to move much further and, thus, taking longer to position the head between tracks.
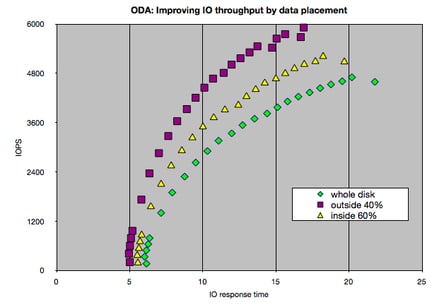
Placing data on the outer 40% of disk space let's you increase throughput from about 2900 IOPS to 4500 IOPS while keeping average response time at 10ms level. That's 50% increase if I put it this way -- I think it's not presented as good on this chart. So while writing this post, I realized there is a much better way to present this information -- we can get rid of concurrent number of IOs as it's rather irrelevant for this analysis: 
This chart much better how much more IOPS you can do by placing data on the outer tracks of a disk while keeping the average response time on the same level.
On this good note, I'll round up this blog post. Stay tuned for analysis of ODA's sequential large IO and for SSD benchmark.
Share this
Share this
More resources
Learn more about Pythian by reading the following blogs and articles.
Oracle E-Business Suite Database Upgrade to 19c

Dipping Your Toes Into Building an Analytics Platform on Google Cloud Platform
Five Best Practices for Setting Dispatchers on Shared Connections
Ready to unlock value from your data?
With Pythian, you can accomplish your data transformation goals and more.


