Investigating IO performance on Amazon RDS for Oracle
TABLE SCAN FULL in their execution. It seemed, that in many cases, it just took a single query to max out the allocated IOPS (IOs per second) or bandwidth, which in turn would caused overall slowness of the RDS instance. The search in documentation showed that it could have been caused by how IO operations are counted on Amazon RDS, as it's quite different from what a routine Oracle DBA like me would expect. For multi-block reads the database (depending on storage) would typically issue IOs of size up to 1MB, so if an 8K block size was used the table scans would read up to 128 blocks in a single IO of
db file scattered read or
direct path read. Now, pay attention to what the
AWS documentation says:
While Provisioned IOPS (io1 storage) can work with I/O sizes up to 256 KB, most databases do not typically use such large I/O. An I/O request smaller than 32 KB is handled as one I/O; for example, 1000 16 KB I/O requests are treated the same as 1000 32 KB requests. I/O requests larger than 32 KB consume more than one I/O request; Provisioned IOPS consumption is a linear function of I/O request size above 32 KB. For example, a 48 KB I/O request consumes 1.5 I/O requests of storage capacity; a 64 KB I/O request consumes 2 I/O requests, etc. ... Note that I/O size does not affect the IOPS values reported by the metrics, which are based solely on the number of I/Os over time. This means that it is possible to consume all of the IOPS provisioned with fewer I/Os than specified if the I/O sizes are larger than 32 KB. For example, a system provisioned for 5,000 IOPS can attain a maximum of 2,500 IOPS with 64 KB I/O or 1,250 IOPS with 128 KB IO. ... and ...
I/O requests larger than 32 KB are treated as more than one I/O for the purposes of PIOPS capacity consumption. A 40 KB I/O request will consume 1.25 I/Os, a 48 KB request will consume 1.5 I/Os, a 64 KB request will consume 2 I/Os, and so on. The I/O request is not split into separate I/Os; all I/O requests are presented to the storage device unchanged. For example, if the database submits a 128 KB I/O request, it goes to the storage device as a single 128 KB I/O request, but it will consume the same amount of PIOPS capacity as four 32 KB I/O requests. Based on the statements above it looked like the large 1M IOs issued by the DB would be accounted as 32 separate IO operations, which would obviously exhaust the allocated IOPS much sooner than expected. The documentation talks only about Provisioned IOPS, but I think this would apply to General Purpose SSDs (gp2 storage) too, for which the IOPS baseline is 3 IOPS/GB (i.e. 300 IOPS if allocated size is 100GB of gp2). I decided to do some testing to find out how RDS for Oracle handles large IOs.
The Testing
For testing purposes I used the following code to create a 1G table (Thanks Connor McDonald and AskTom): [code lang="sql"] ORCL> create table t(a number, b varchar2(100)) pctfree 99 pctused 1; Table T created. ORCL> insert into t values (1,lpad('x',100)); 1 row inserted. ORCL> commit; Commit complete. ORCL> alter table t minimize records_per_block; Table T altered. ORCL> insert into t select rownum+1,lpad('x',100) from dual connect by level<131072; 131,071 rows inserted. ORCL> commit; Commit complete. ORCL> exec dbms_stats.gather_table_stats(user,'T'); PL/ORCL procedure successfully completed. ORCL> select sum(bytes)/1024/1024 sizemb from user_segments where segment_name='T'; SIZEMB 1088 ORCL> select value/1024/1024 buffer_cache from v$sga where name='Database Buffers'; BUFFER_CACHE 1184 [/code] The code for testing will be: [code lang="sql"] exec rdsadmin.rdsadmin_util.flush_buffer_cache; alter session set "_serial_direct_read"=always; alter session set db_file_multiblock_read_count=&1; -- Run FTS against T table forever. declare n number:=1; begin while n>0 loop select /*+ full(t) */ count(*) into n from t; end loop; end; / [/code] Basically, I'll flush the buffer cache, which will force the direct path reads by setting_serial_direct_read to "ALWAYS", and then, will choose the
db_file_multiblock_read_count based on how big IOs I want to issue (note, by default the
db_file_multiblock_read_count is not set on RDS, and it resolves to 128, so the maximum size of an IO from the DB is 1 MB), I'll test with different sizes of IOs, and will Capture the throughput and effective IOPS by using the "Enhanced Monitoring" of the RDS instance.
Side-note: the testing I had to do turned out to be more complex than I had expected before I started. In few cases, I was limited by the instance throughput before I could reach the maximum allocated IOPS, and due to this, the main testing needed to be one on large enough instance (db.m4.4xlarge), that had more of the dedicated EBS-throughput.
The Results
Provisioned IOPS storage
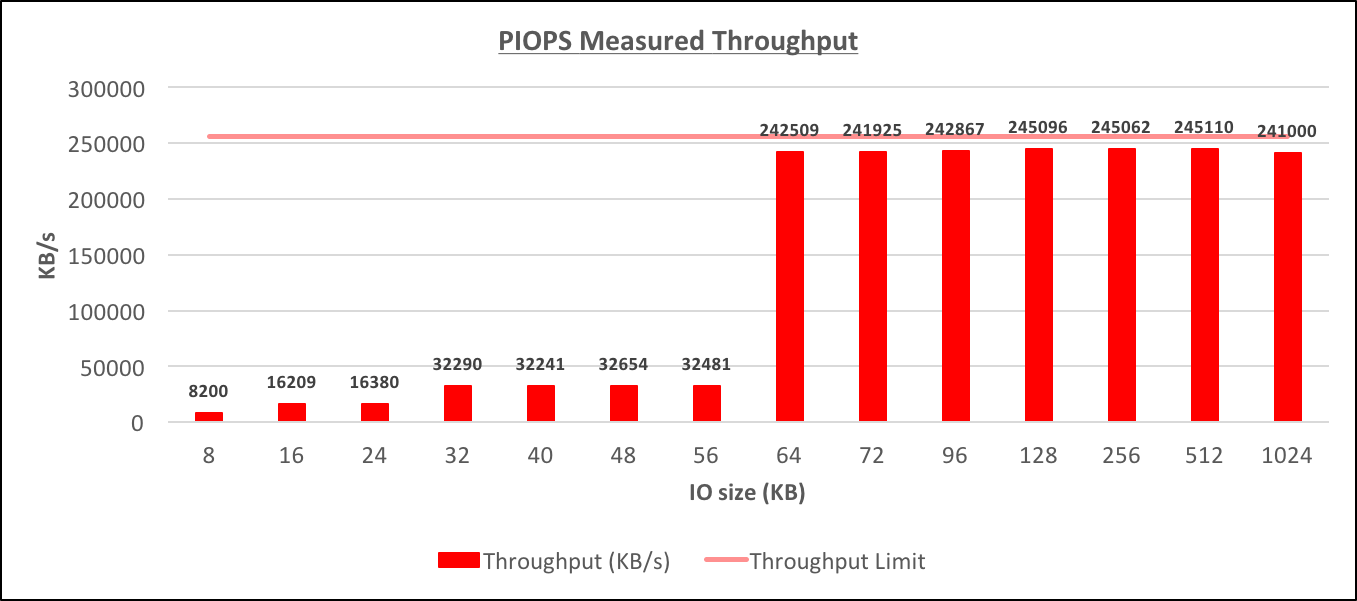
Testing was done on a db.m4.4xlarge instance that was allocated 100GB of io1 storage of 1000 Provisioned IOPS. The EBS-optimized throughput for such instance is 256000 KB/s. The tests were completed by usingdb_file_multiblock_read_count of 1, 2, 3, 4, 5, 6, 7, 8, 9, 12, 16, 32, 64 and 128. For each test the Throughput and IO/s were captured (from RDS CloudWatch graphs), and also the efficient IO size was derived. The DB instance was idle, but still, there could be few small IO happening during the test. [caption id="attachment_95443" align="aligncenter" width="1357"]
 Provisioned IOPS Measured Throughput[/caption] [caption id="attachment_95437" align="aligncenter" width="1362"]
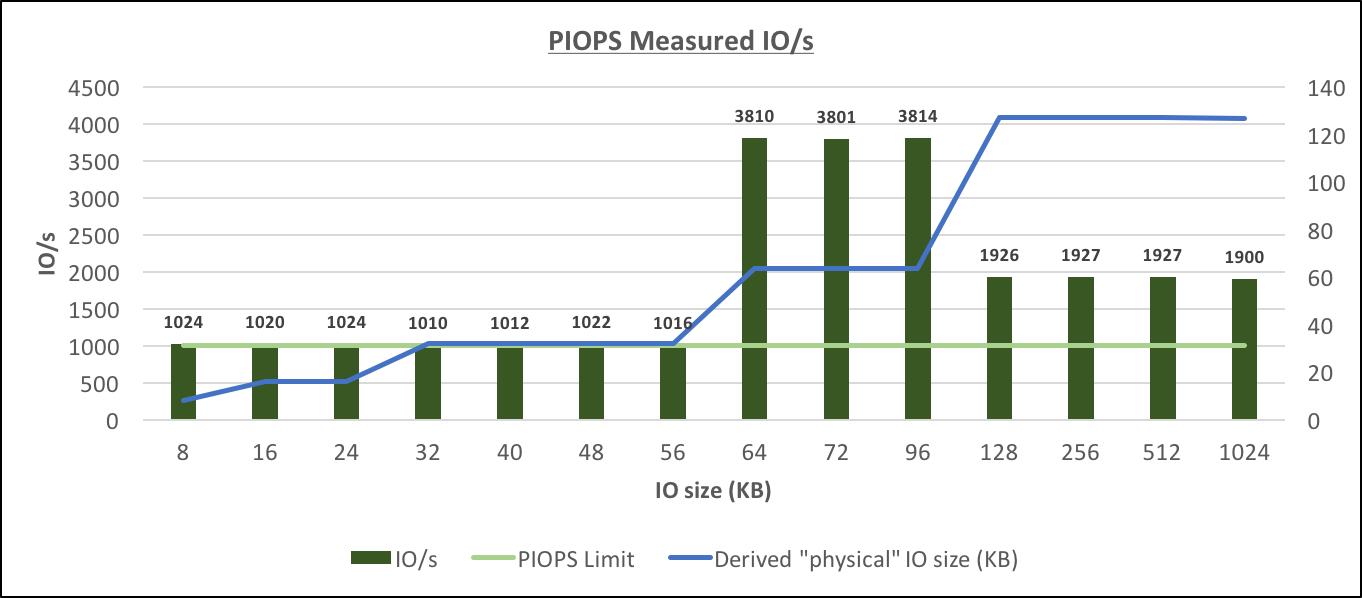 Provisioned IOPS Measured IO/s[/caption] From the graphs above the following features that are not documented can be observed:
- The RDS instance is dynamically choosing the physical IO size (I'll call them "physical", just to differentiate that these are the IOs to storage, while in fact, that's only what I see in the CLoudWatch graphs, the real physical IO could be something different) based on the size of the IO request from the database. The possible physical IO sizes appear to be 16K, 32K, 64K, 128K and probably also 8K (this could also be in fact 16K physical IO reading just 8K of data)
- The IOPS limit applies only to smaller physical IOs sizes (up to 32K), for larger physical IOs (64K, 128K) the throughput is the limiting factor of the IO capability. The throughput limit appears to be quite close to the maximum throughput that the instance is capable of delivering, but at this point, it's not clear how the throughput limit for particular situation is calculated.
Throughput Limits for Provisioned IOPS
I ran additional tests on differently sized instances with io1 storage to understand better how the maximum throughput was determined. The graph below represents the throughput achieved on different instances, but all had the same 100G of 1000 PIOPS io1 storage. The throughput was done by using db_file_multiblock_read_count=128: [caption id="attachment_95435" align="aligncenter" width="1363"]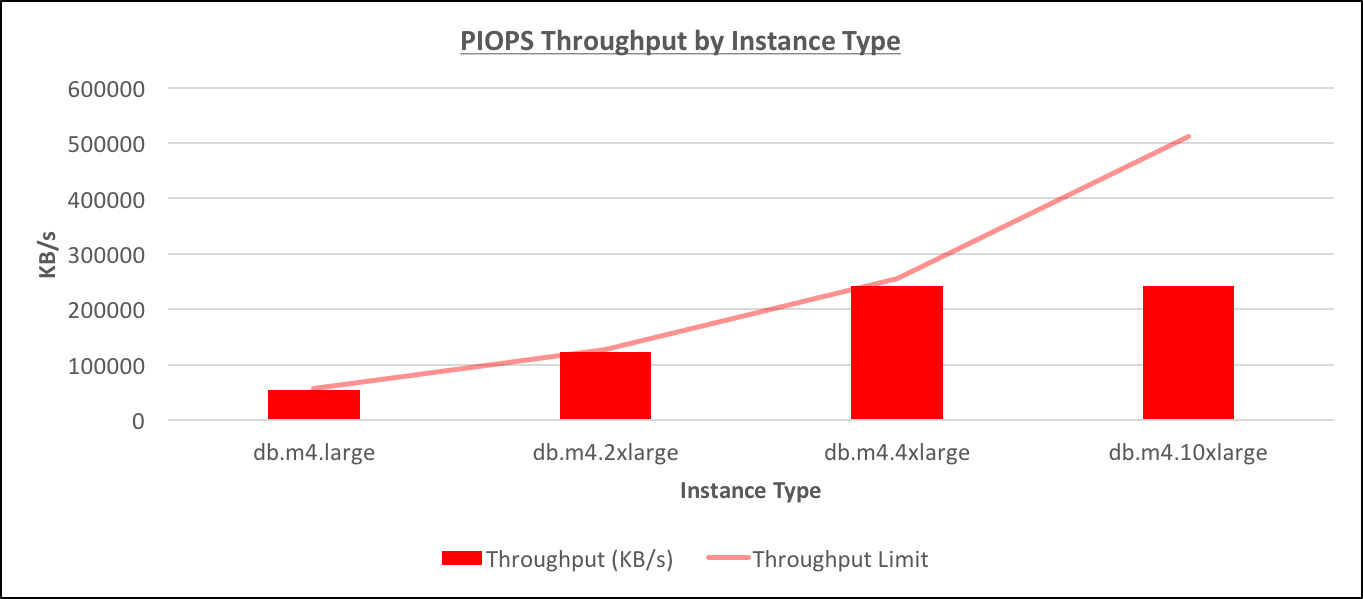 PIOPS Throughput by Instance Type[/caption] it appears that the maximum throughput is indeed limited by the instance type, except for the very largest instance db.m4.10xlarge (For this instance the situation is somewhat weird even in the documentation because the maximum throughput is mentioned as 500 MB/s, but the maximum throughput for a single io1 EBS volume, which should be there underneath the RDS, is just 320 MB/s, and I was unable to reach any of these limits)
General Purpose SSD storage
Testing was done on a db.m4.4xlarge instance that was allocated 100GB of gp2 storage with 300 IOPS baseline. The EBS-optimized throughput for such instance is 256000 KB/s. The tests were conducted similarly to how they were done for Provisioned IOPS above (note, this is the baseline performance, not burst performance) [caption id="attachment_95441" align="aligncenter" width="1363"]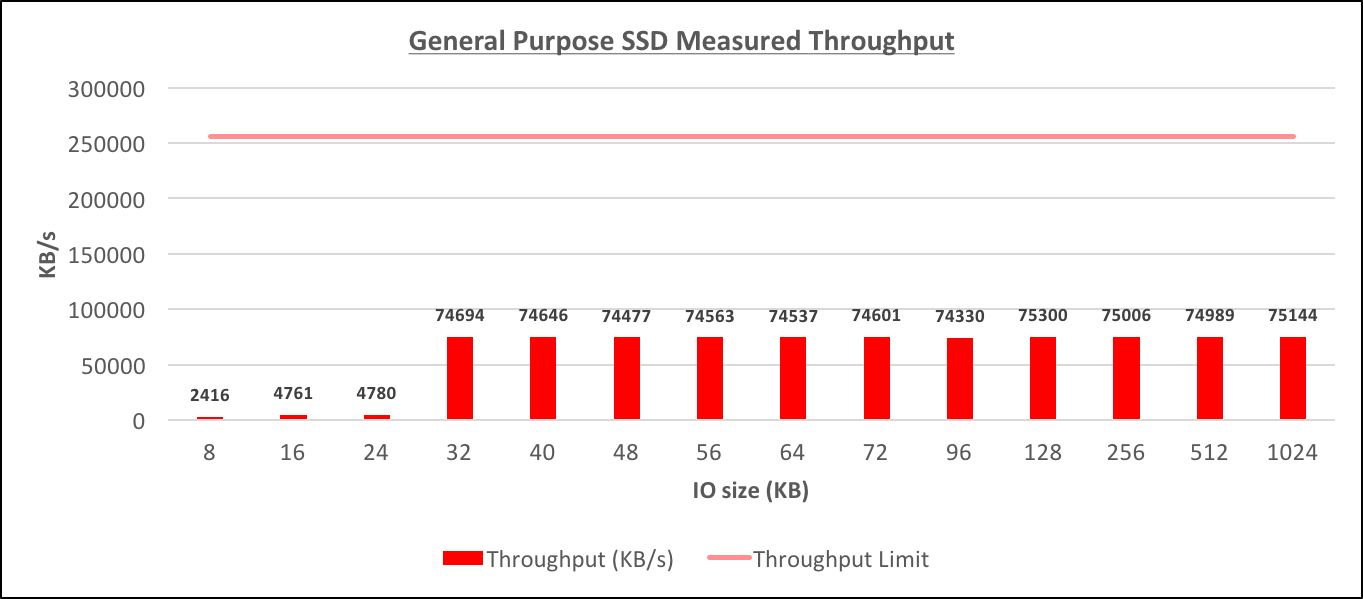 General Purpose SSD Measured Throughput[/caption] [caption id="attachment_95439" align="aligncenter" width="1362"]
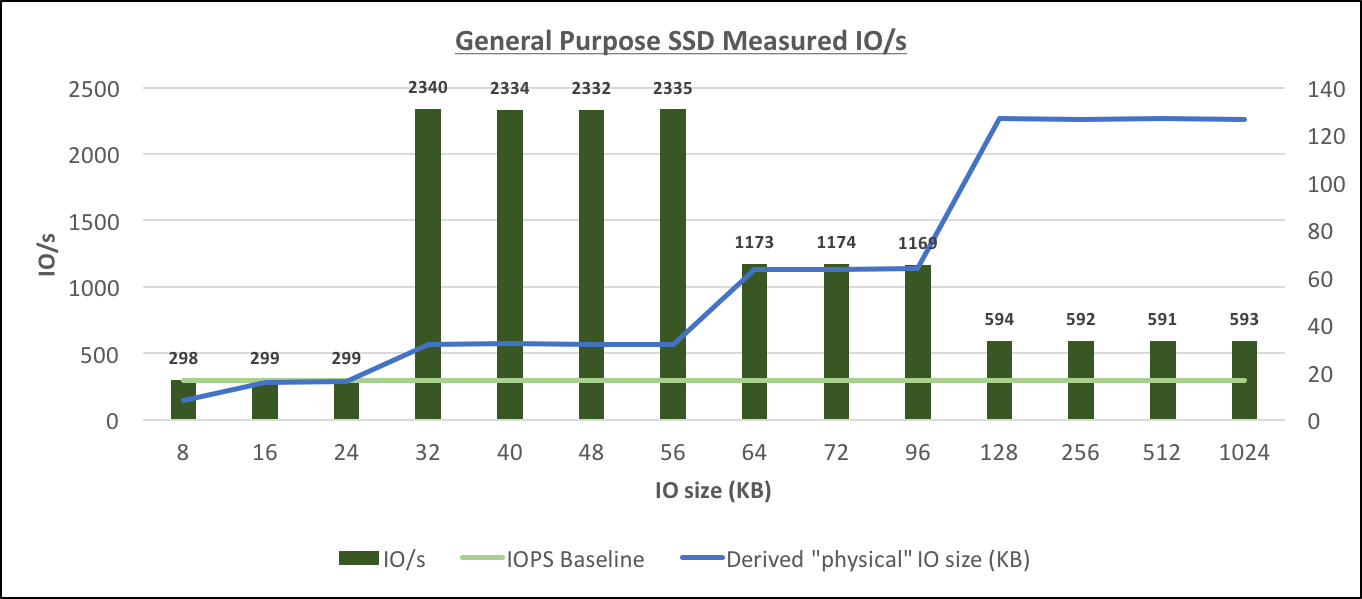 General Purpose SSD Measured IO/s[/caption] Similarly to Provisioned IOPS, the General Purpose SSD storage behaves differently from what's explained in the documentation:
- The physical IO size again is calculated dynamically based on the size of the IO request from the database. The possible sizes appear to be the same as for io1: (8K), 16K, 32K, 64K and 128K.
- The IOPS limit (to baseline level) appears to apply to IO sizes only up to 16K (compared to 32K in case of Provisioned IOPS), for larger physical IOs starting from 32K, the limit appears to be throughput-driven.
- It's not clear how the throughput limit is determined for the particular instance/storage combination, but in this case, it appeared to be around 30% of the maximum throughput for the instance, however, I didn't confirm the same ratio for db.m4.large where the maximum achievable throughput depended on the allocated size of the gp2 storage.
Burst Performance
I haven't collected enough data to derive anything concrete, but during my testing I observed that Burst performance applied to both maximum IOPS and also the maximum throughput. For example, while testing on db.m4.large (max instance throughput of 57600 KB/s) with 30G of 90 IOPS baseline performance, I saw that for small physical IOs it allowed bursting up to 3059 IOPS for short periods of time, while normally it indeed allowed only 300 IOPS. For larger IOs (32K+), the baseline maximum throughput was around 24500 KB/s, but the burst throughput was 55000 KB/sThroughput Limits for General Purpose SSD storage
I don't really know how the maximum allowed throughput is calculated for different instance type and storage configuration for gp2 instances, but one thing is clear: that instance size, and size of the allocated gp2 storage are considered in determining the maximum throughput. I was able to achieve the following throughput measures when gp2 storage was used:- 75144 KB/s (133776 KB/s burst) on db.m4.4xlarge (100G gp2)
- 54500 KB/s (same as burst, this is close to the instance limit) on db.m4.large (100G gp2)
- 24537 KB/s (54872 KB/s burst) on db.m4.large (30G gp2)
- 29116 KB/s (burst was not measured) on db.m4.large (40G gp2)
- 37291 KB/s (burst was not measured) on db.m4.large (50G gp2)
Conclusions
The testing provided some insight into how the maximum performance of IO is determined on Amazon RDS for Oracle, based on the instance type, storage type, and volume size. Despite finding some clues I also understood that managing IO performance on RDS is far more difficult than expected for mixed size IO requests that are typically issued by Oracle databases. There are many questions that still need to be answered (i.e. how the maximum throughput is calculated for gp2 storage instances) and it'd take many many hours to find all the answers. On the other-hand, the testing already revealed a few valuable findings:- Opposite to the documentation that states that all IOs are measured and accounted in 32KB units, we found that IO units reported by Amazon can be of sizes 8K (probably), 16K, 32K, 64K and 128K
- For small physical IOs (up to 32K in case of Provisioned IOPS and up to 16K in case of General Purpose SSD) the allocated IOPS is used as the limit for the max performance.
- For larger physical IOs (from 64K in case of Provisioned IOPS and from 32K in case of General Purpose SSD) the throughput is used as the limit for the max performance, and the IOPS limit no longer applies.
- The Burst performance applies to both IOPS and throughput
TABLE SCAN FULL severely impacting the overall performance, I found that in many cases we were using small RDS instances db.m3.large or db.m4.large, for which the maximum throughput was ridiculously small, and we were hitting the throughput limitation, not the IOPS limit that actually didn't apply to the larger
physical IOs on gp2 storage.
On this page
Share this
Share this
More resources
Learn more about Pythian by reading the following blogs and articles.
Investigating IO performance on Amazon EC2
![]()
Investigating IO performance on Amazon EC2
Dec 30, 2016 12:00:00 AM
7
min read
Enable Oracle Flash Cache on Red Hat Linux
![]()
Enable Oracle Flash Cache on Red Hat Linux
May 6, 2021 12:00:00 AM
2
min read
AWS Redshift cluster sizing
![]()
AWS Redshift cluster sizing
Dec 3, 2015 12:00:00 AM
3
min read
Ready to unlock value from your data?
With Pythian, you can accomplish your data transformation goals and more.
